On this page you can see the statistics for the particular period of time and for the selected products.
The page is available from the menu Reports ⇒ Sales. Also, it opens every time you log in to the account.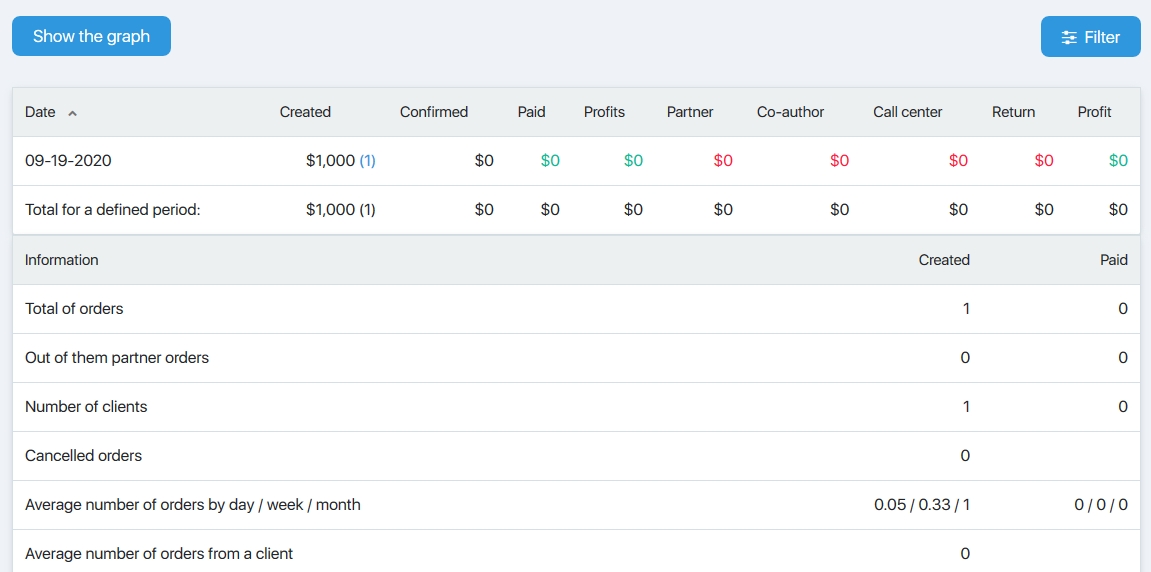
As you click on the blue numbers on the brackets next to the sums in the Created/Confirmed/Paid columns, it opens the Bills page (with the filter by date and the state of a payment).
Graph
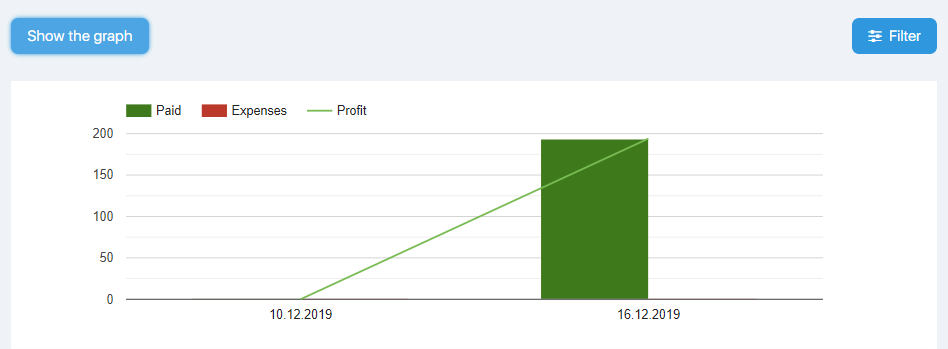
The Show the graph button expands a graphic interpretation of the main parameters at the top of the page:
- green bar – incomes;
- red bar – expenses;
- broken line – profit.
Filter
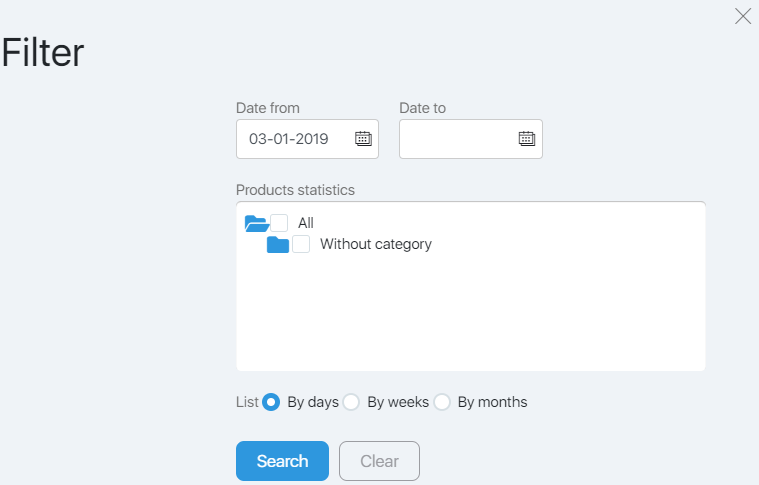 The filter allows you to set up the way the table looks.
Select the period and the products to display the statistics.
Data on all the product for the last months is displayed on default.
Also, you can select the type of grouping – by days, weeks or months.
Specify necessary filter settings and click the Search button. To return to the default settings use the Clean button.
