On this page you can track the dynamic of changes in the subscription base.
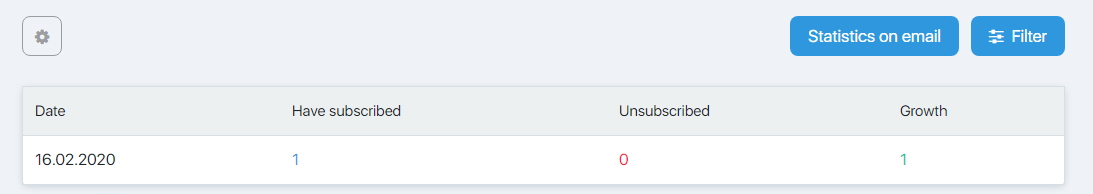
At the top of the table there is information that summarizes subscriptions for the selected period.
Below you can see the table broken down into days, weeks or months (it depends on the filter settings).
The numbers in the Subscribed and Unsubscribed columns are clickable. When you click it, the Subscribers page opens. The data at this page is filtered according to the relevant conditions, so you can see who exactly has subscribed or unsubscribed.
Filter
The filter allows you to set up a type, period and format of data in the table.
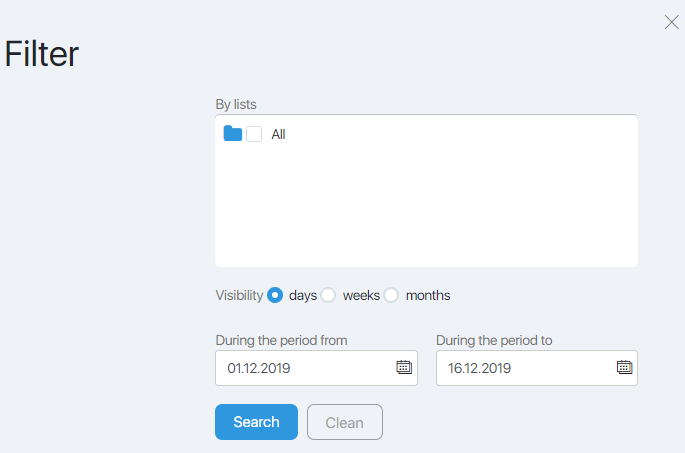
In the top field you can specify the groups/categories of statistics to be displayed. It is all of the groups on default.
The Visibility button allows you to set up the grouping of the data in the table by days, weeks or months.
The Period from…to block allows you to select a period to show the statistics. It’s the current month on default.
It is not necessary to fill in all the fields of the filter. Set all the filter criteria and click the Search button. The table will show you the data corresponding to the filter conditions. To show the detailed table click the Filter button and then the Clear button.
Statistics via email
Clicking this button opens the Send statistics via email page. Here you can set up the parameters of sending the statistics to your email.
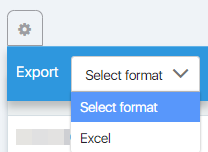
Data export
The gear button allows you to export the table to MS Excel.