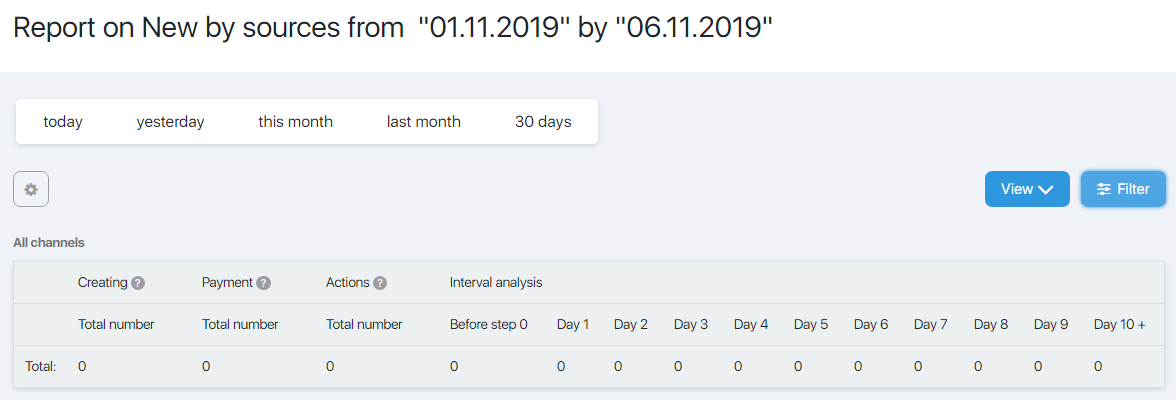
This page contains a report on traffic sources of a selected sales funnel. Here you can see all the channels that are driving traffic to the sales funnel – direct referrals, affiliate traffic, advertising, and so on.
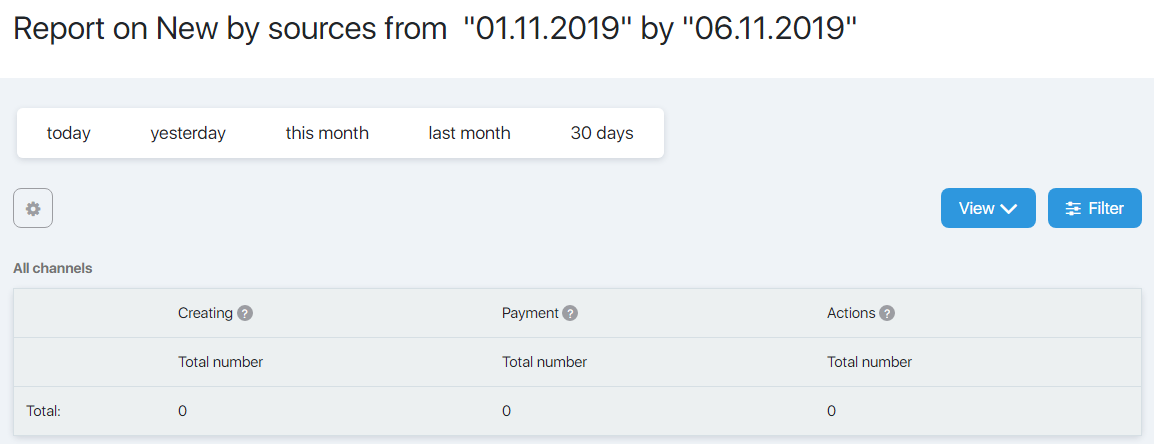
The page allows you to track how many people have come to each step of the funnel.
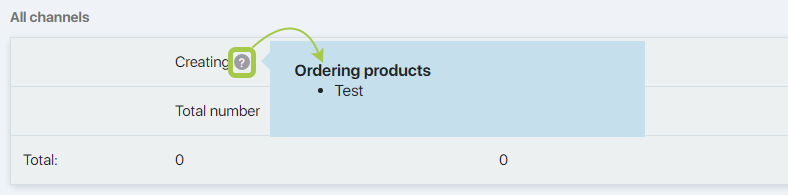
Click the question mark next to the name of a step to get a hint about what actions are calculated at that step.
Filter
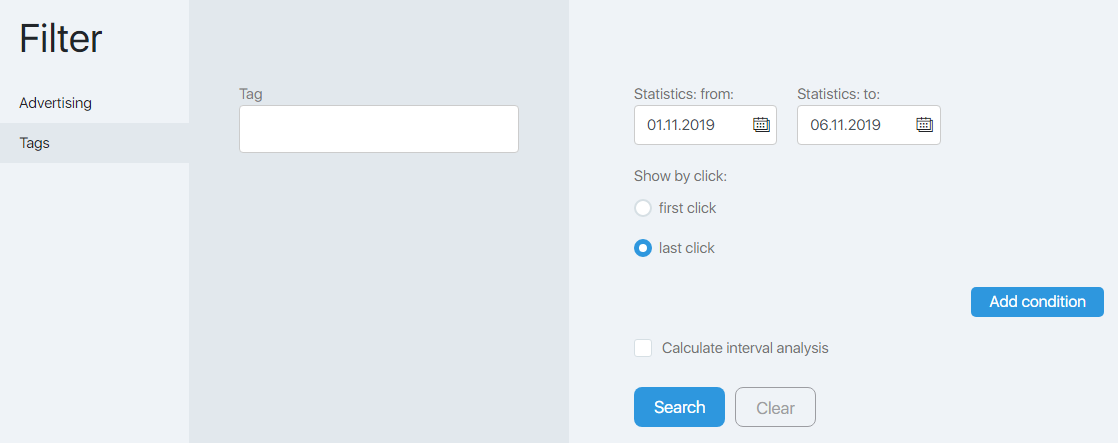
The filter allows you to set up the output of statistics data.
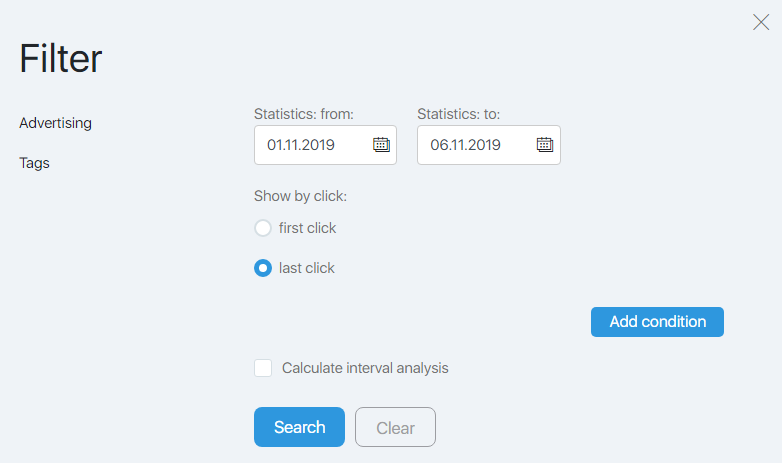
The Retrieve statistics from…to field allows you to set a period to calculate the statistics.
The most popular periods of time (today, yesterday, this month, last month, 30 days) are contained in the quick filter at the top of the page.
The Show by click field allows you retrieve the statistics by the first/last click.
The side filter menu contains the Advertising and Tags tabs, which allow you to retrieve statistics not from the whole funnel but just by particular parameters.
At the Advertising tab you can retrieve statistics by a particular channel.
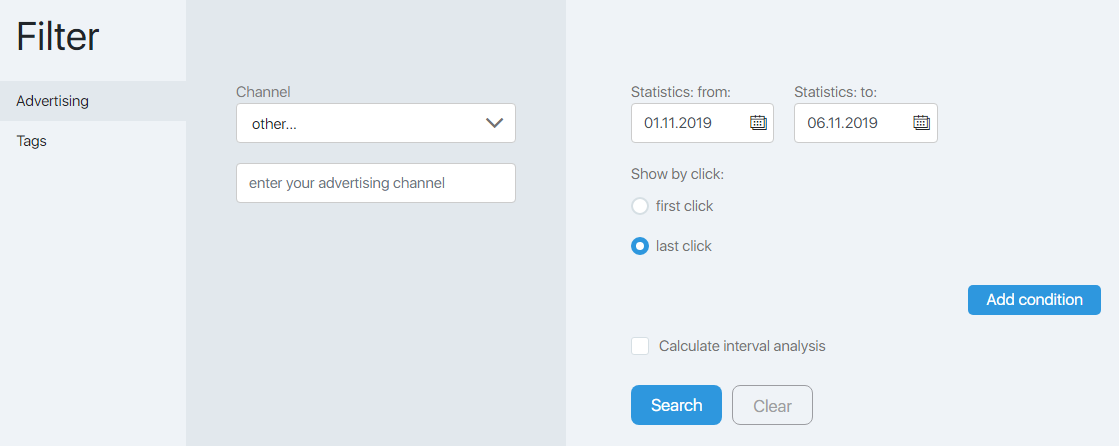
At the Tag tab in the field with the same name you can specify a tag to retrieve the statistics of that funnel.
The Read the interval analysis check-box opens an additional tab where you can set up the parameters of the calculation.
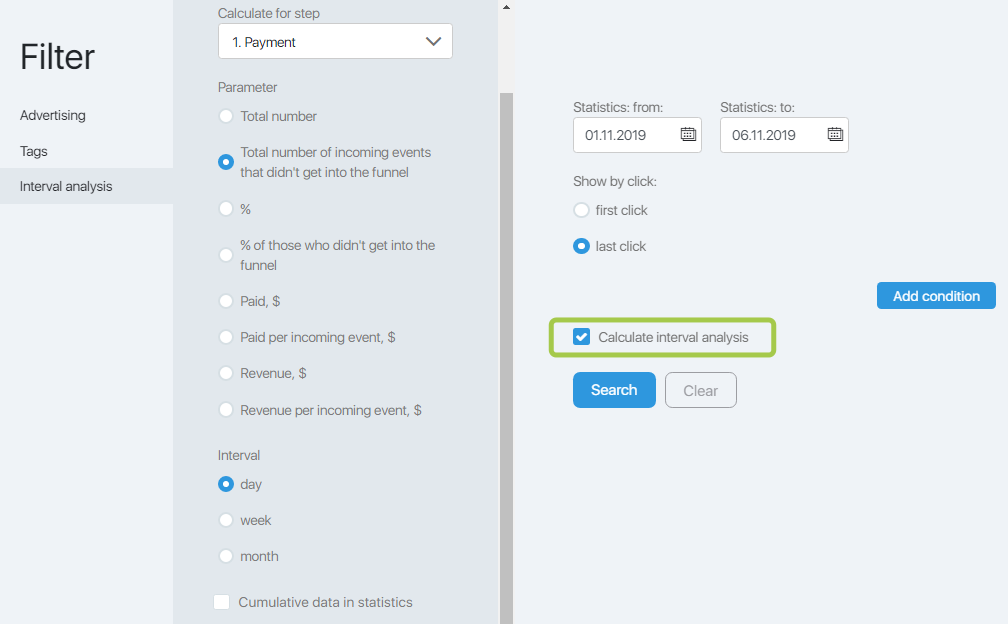
Select the step of the funnel that you want to calculate. After that, set up the selected calculating parameters and the interval to sum up the statistics.
The Cumulative data check-box in the statistics allows you to specify the output as a cumulative total or by individual periods.
As you select Interval Analysis, the appearance of the table will change. The Interval Analysis block will appear with the statistics on the selected parameters with the specified interval.
Visible fields
The View button allows you to add the additional data output to each step of the funnel.
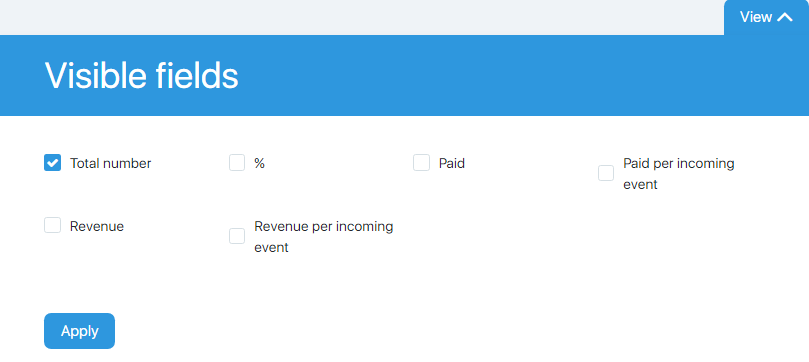
On default only the Amount field is displayed. To display other fields tick the checkboxes next to the names of the fields.
In the example above the % field is activated. So the table will look like that.
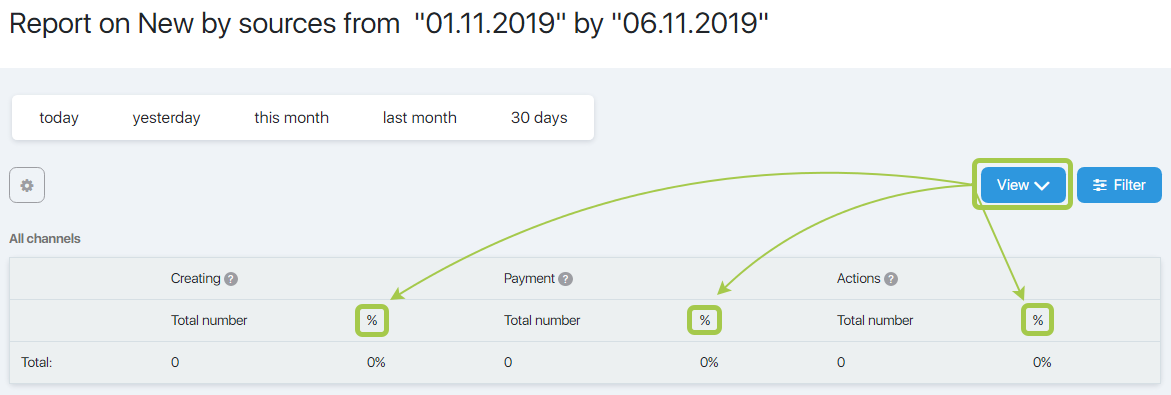
The percentage value will be added to each step in addition to quantitative value.
Data export
The gear button allows you to export data in the CSV format.
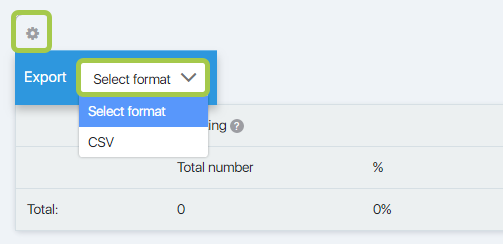
Click it and select the format in the Export field.
