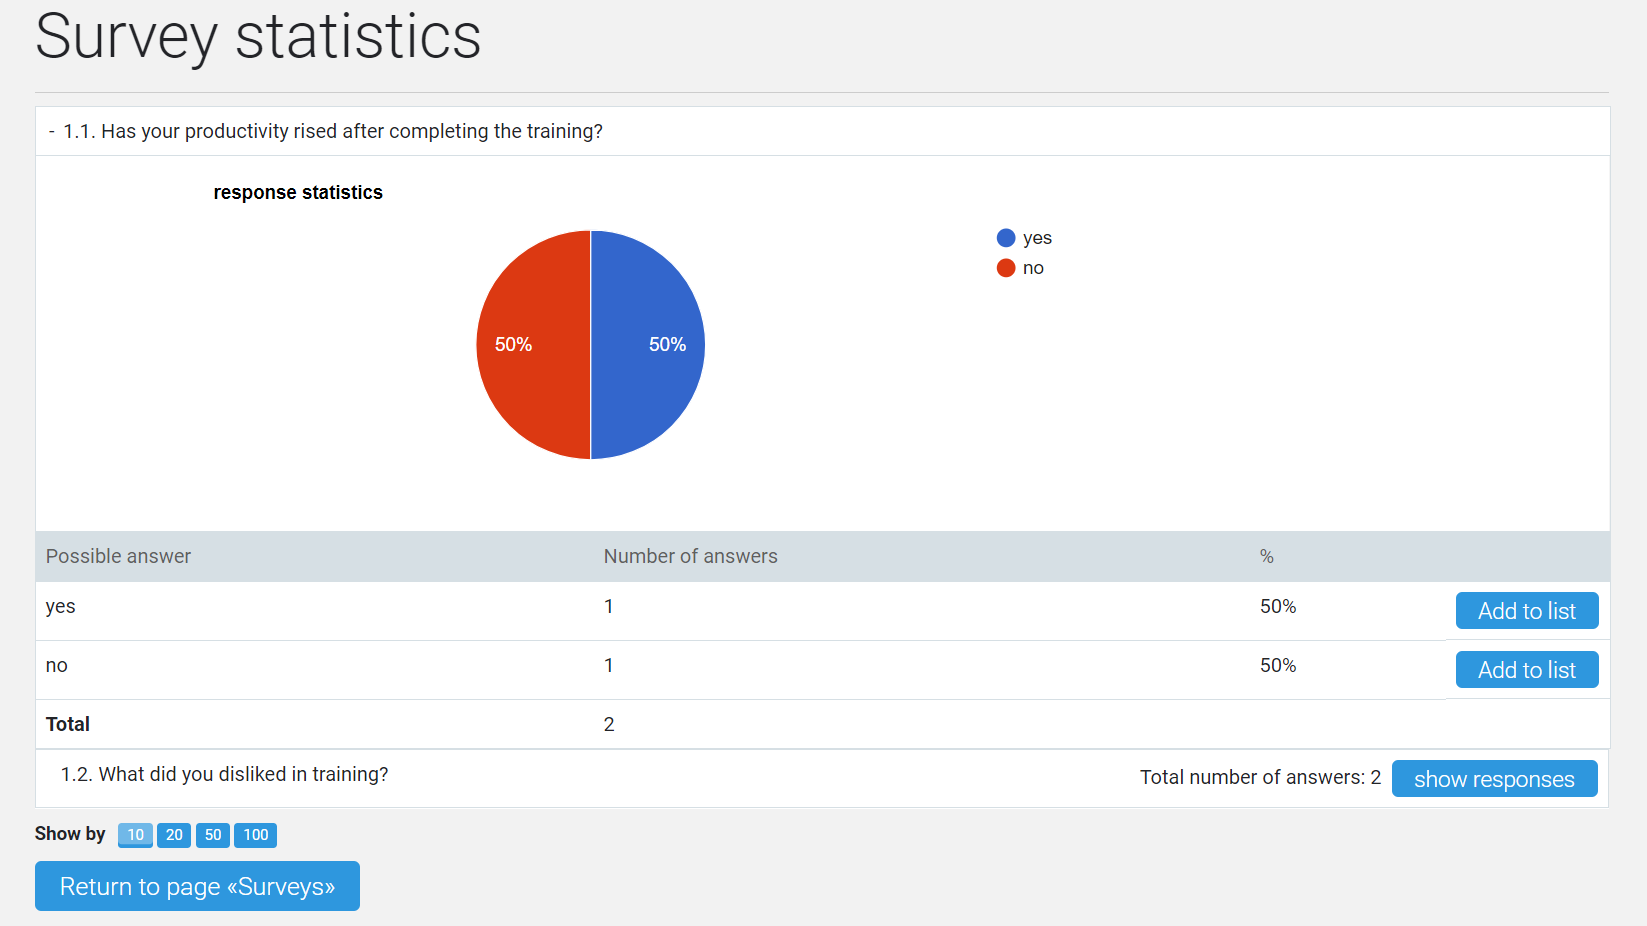
The page contains data on answers to survey questions.
Depending on the type of question, the results look different.
If the question suggests an arbitrary answer, the question line contains the View Responses button. Clicking on it opens a new window, which contains a list of answers given by respondents.
Button Back to the “Surveys Statistics” page closes the answer box.
If the question presupposed the choice of the answer from the existing options, in order to view the statistics of answers it is necessary to click on the line with the question.
Statistics on the issue will be developed on the existing page.
The top part contains a summary pie chart. There is a table below with the answers and the number of those who chose one or the other option.
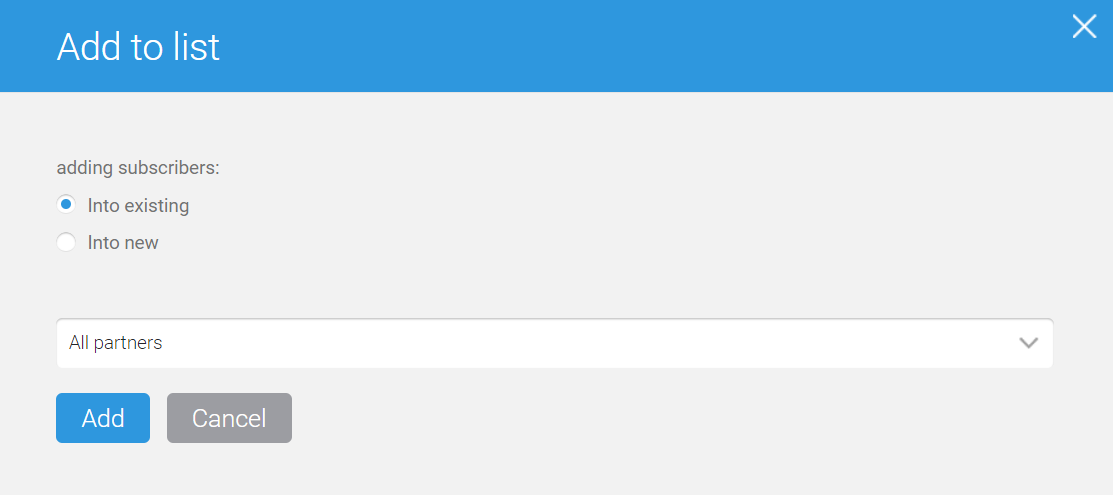
The Add to List button allows (if necessary) to add respondents with a specific answer option to the group.
You can select an existing group (from the dropdown list) or create a new one (then you will need to specify its name).
Clicking on the question collapses the statistics. The page takes the original form.


